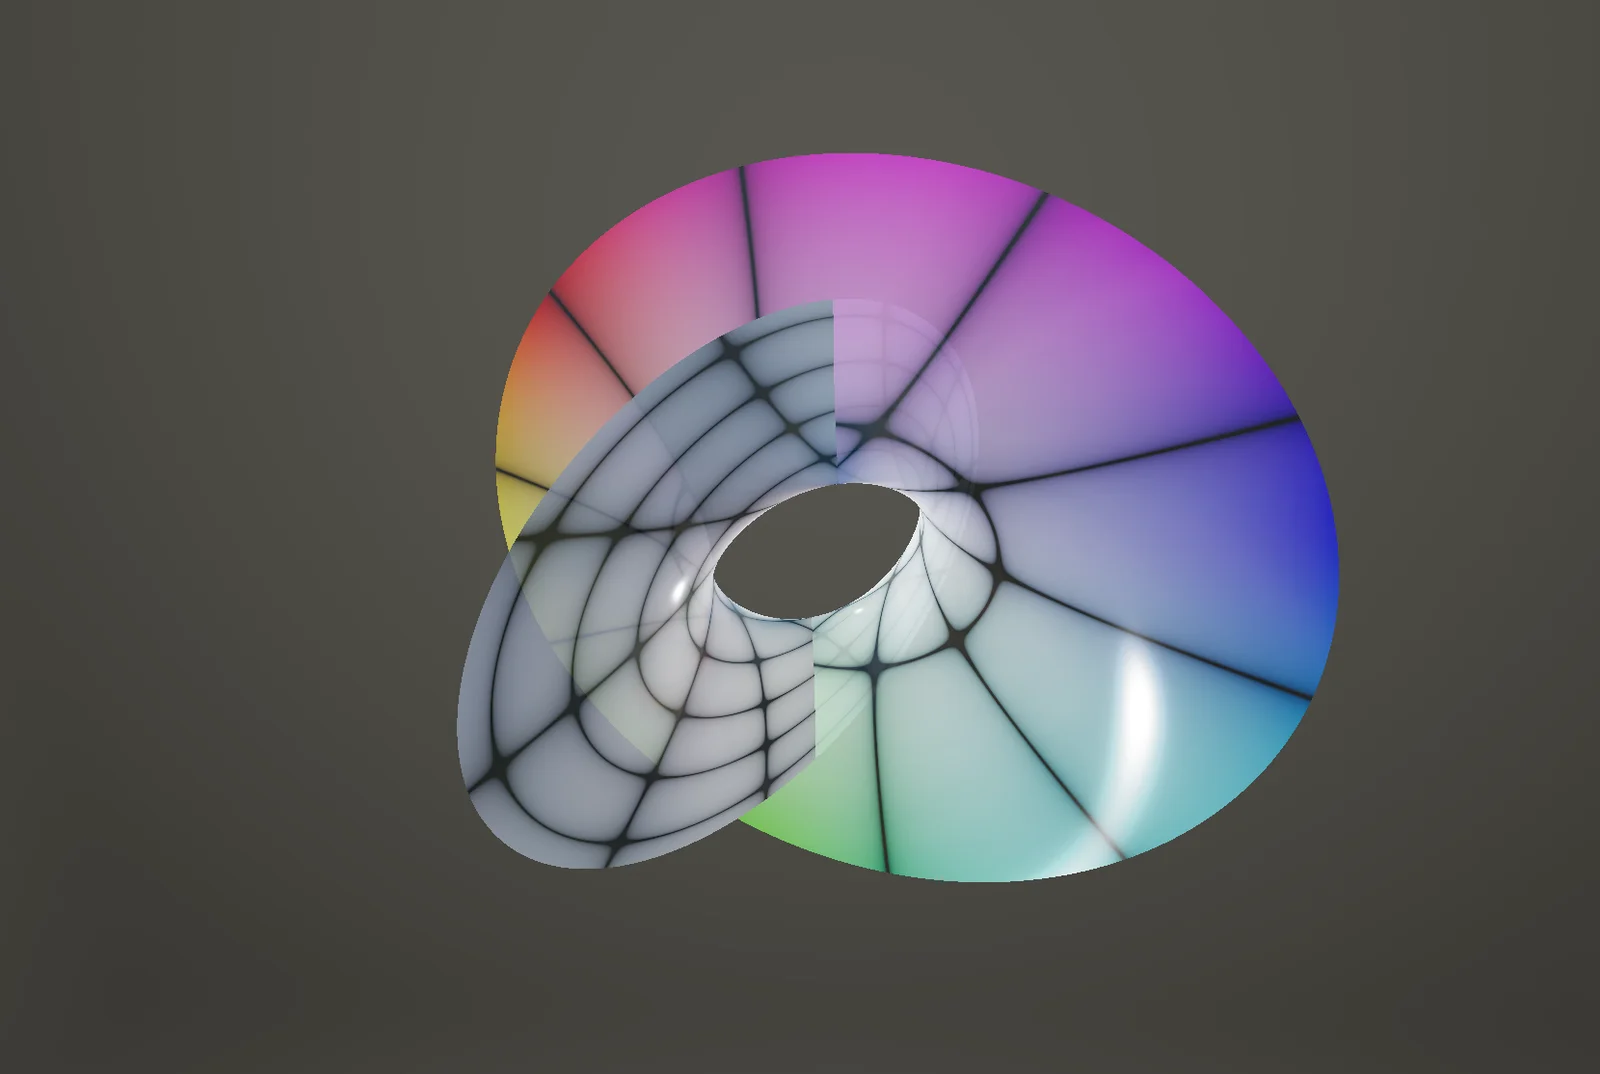
Graphs of complex power functions $z^n$ projected from $\mathbb{C}^2$ to $\mathbb{R}^3$ with domain coloring
This program visualizes the graphs of complex monomials f(z) = z^n as surfaces in C^2, projected to R^3 along a rotating axis so that no particular direction is permanently hidden. The degree n, domain size, grid thickness, hue coloring, and transparency are all adjustable. For positive powers, the graph is plotted over a disk; for negative powers (reciprocals), it is plotted over an annulus to reveal the behavior near the pole at the origin. The surface is colored via domain coloring, with hue determined by argument and saturation by magnitude of the output.
Controls: Click and drag to orbit, scroll to zoom.