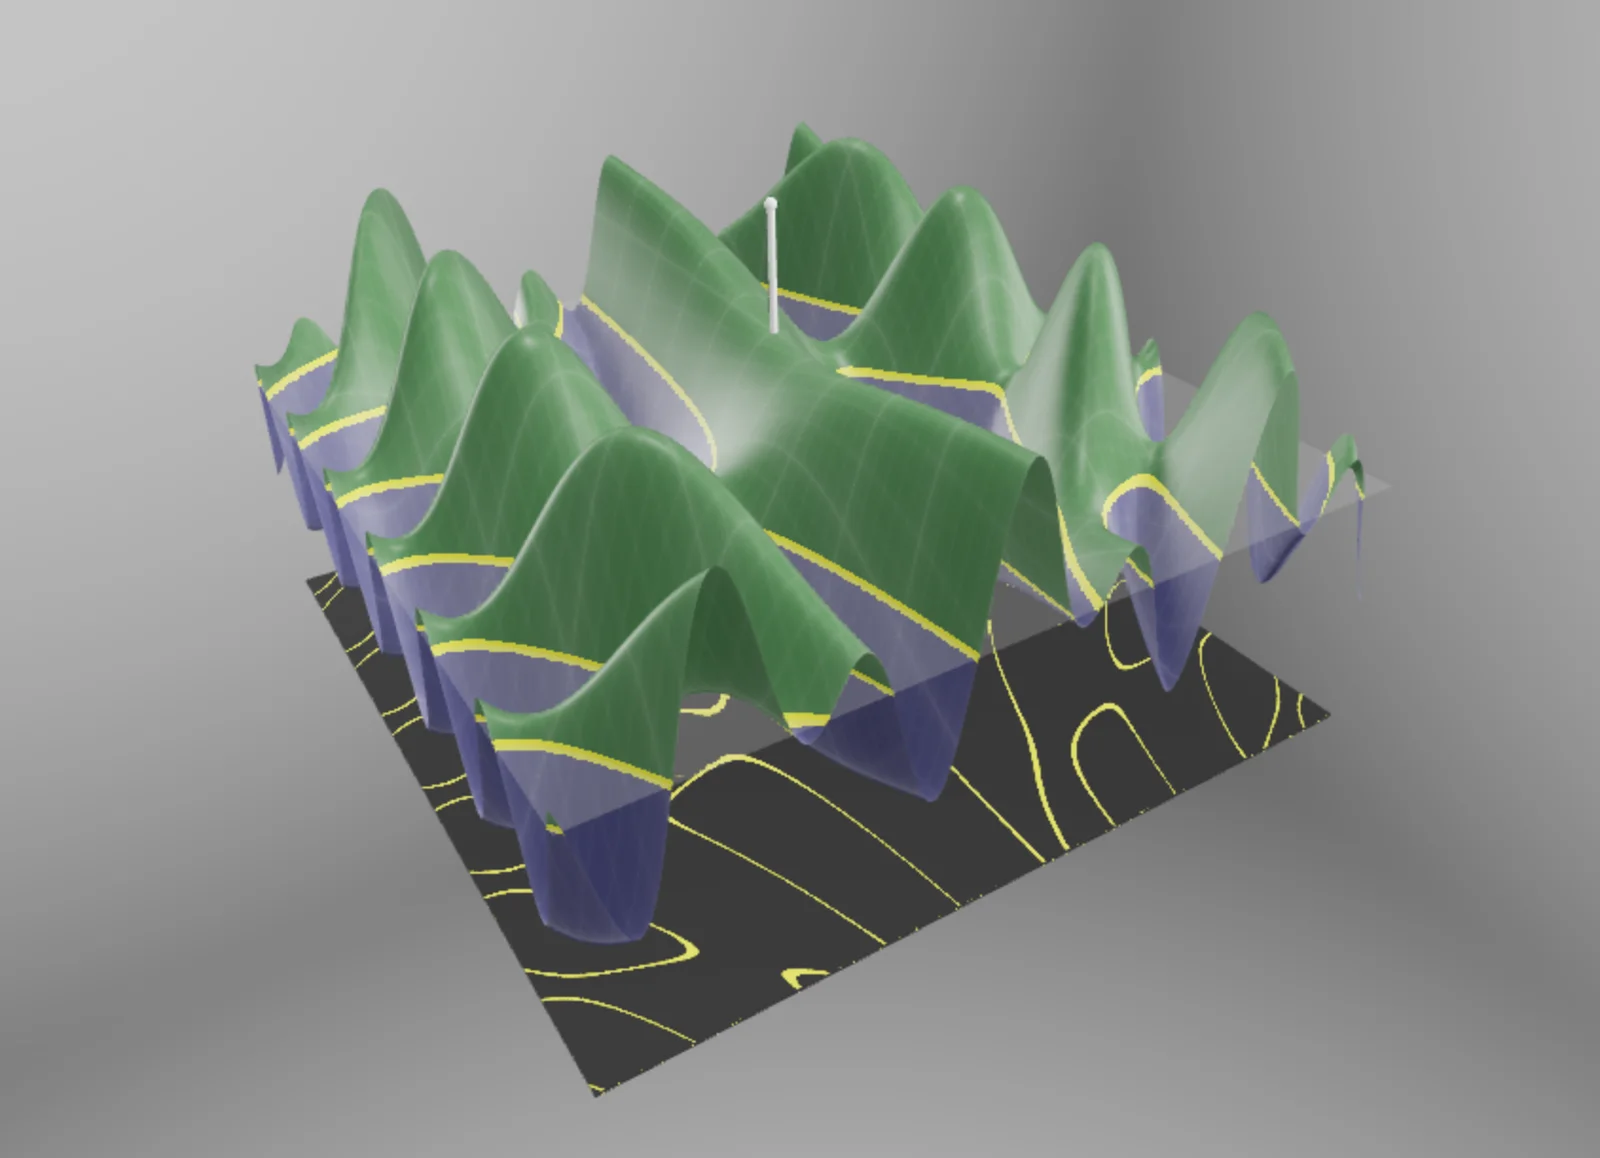
This program displays a surface z = f(x,y) and intersects it with a horizontal plane at a user-controlled height. The resulting intersection curve is a level set (or contour) of the function. As the slicing plane moves up and down, the topology of the level curves changes, illustrating the relationship between a function’s graph and its contour map.
Controls: Click and drag to orbit, scroll to zoom.