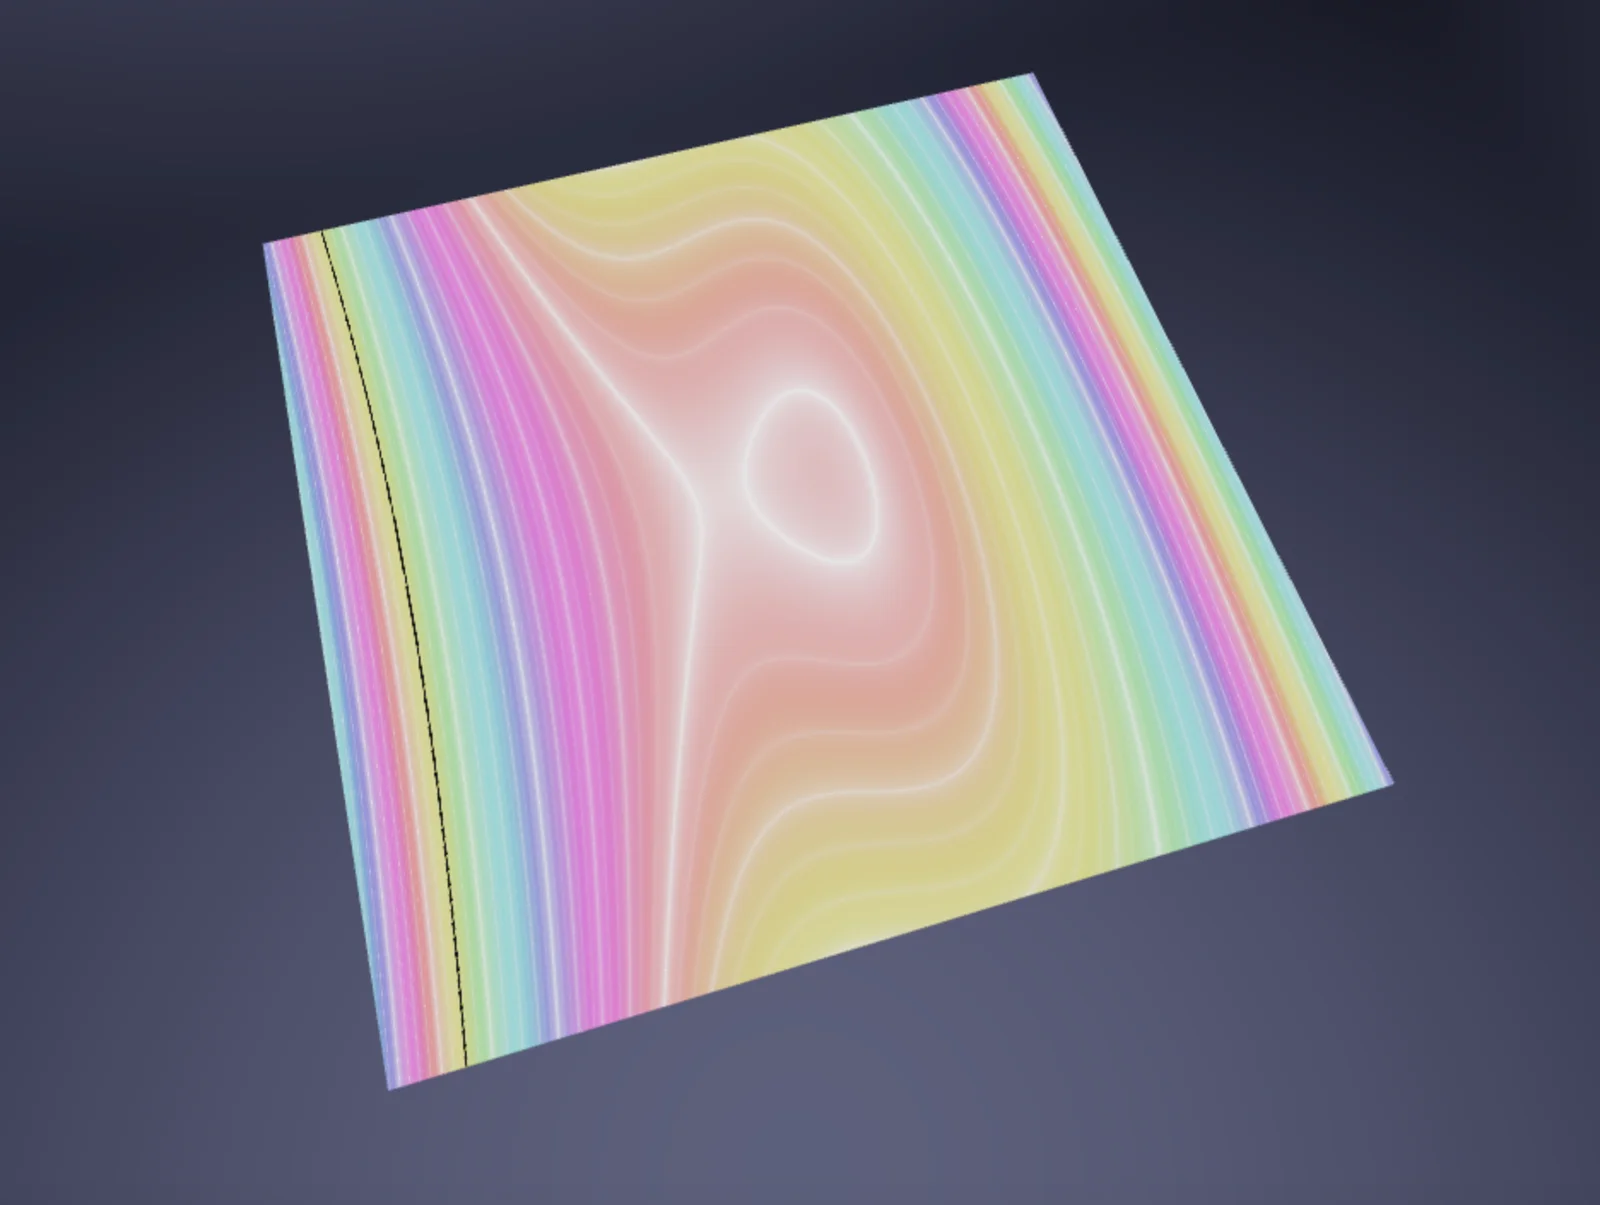
This program displays the graph z = f(x,y) along with several of its level curves f(x,y) = c projected onto the surface and onto the xy-plane below. Level sets are the multivariable analog of the horizontal line test and form the basis of contour maps. The topology of the level sets changes at critical points of the function, where the gradient vanishes.
Controls: Click and drag to orbit, scroll to zoom.