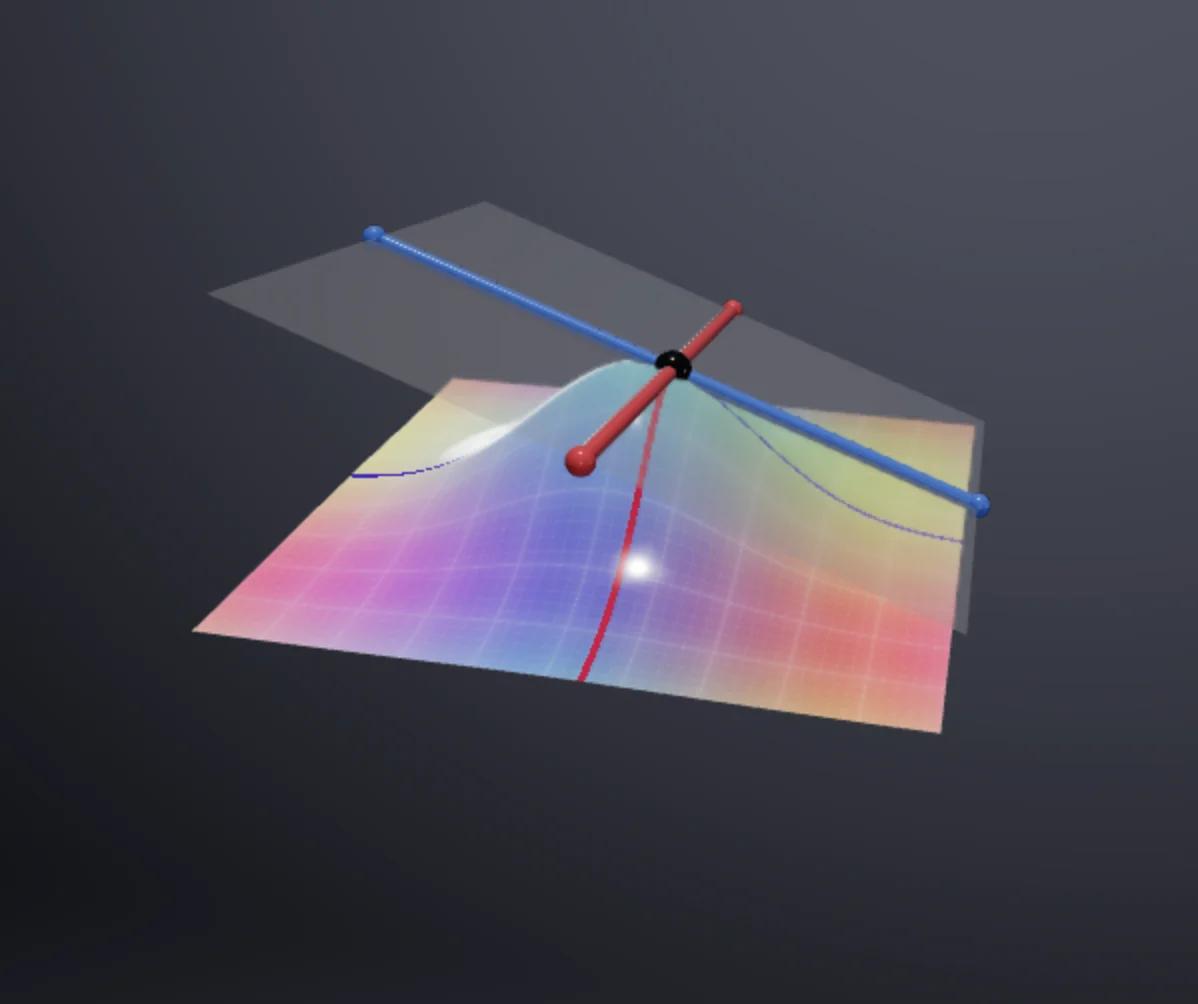
This program plots the graph of a user-defined function y = f(x) together with its tangent line at a point that can be moved along the curve. The tangent line has slope f’(x) and provides the best linear approximation to the function near the point of tangency. This is a fundamental visualization for understanding the derivative as the instantaneous rate of change.
Controls: Click and drag to orbit, scroll to zoom.