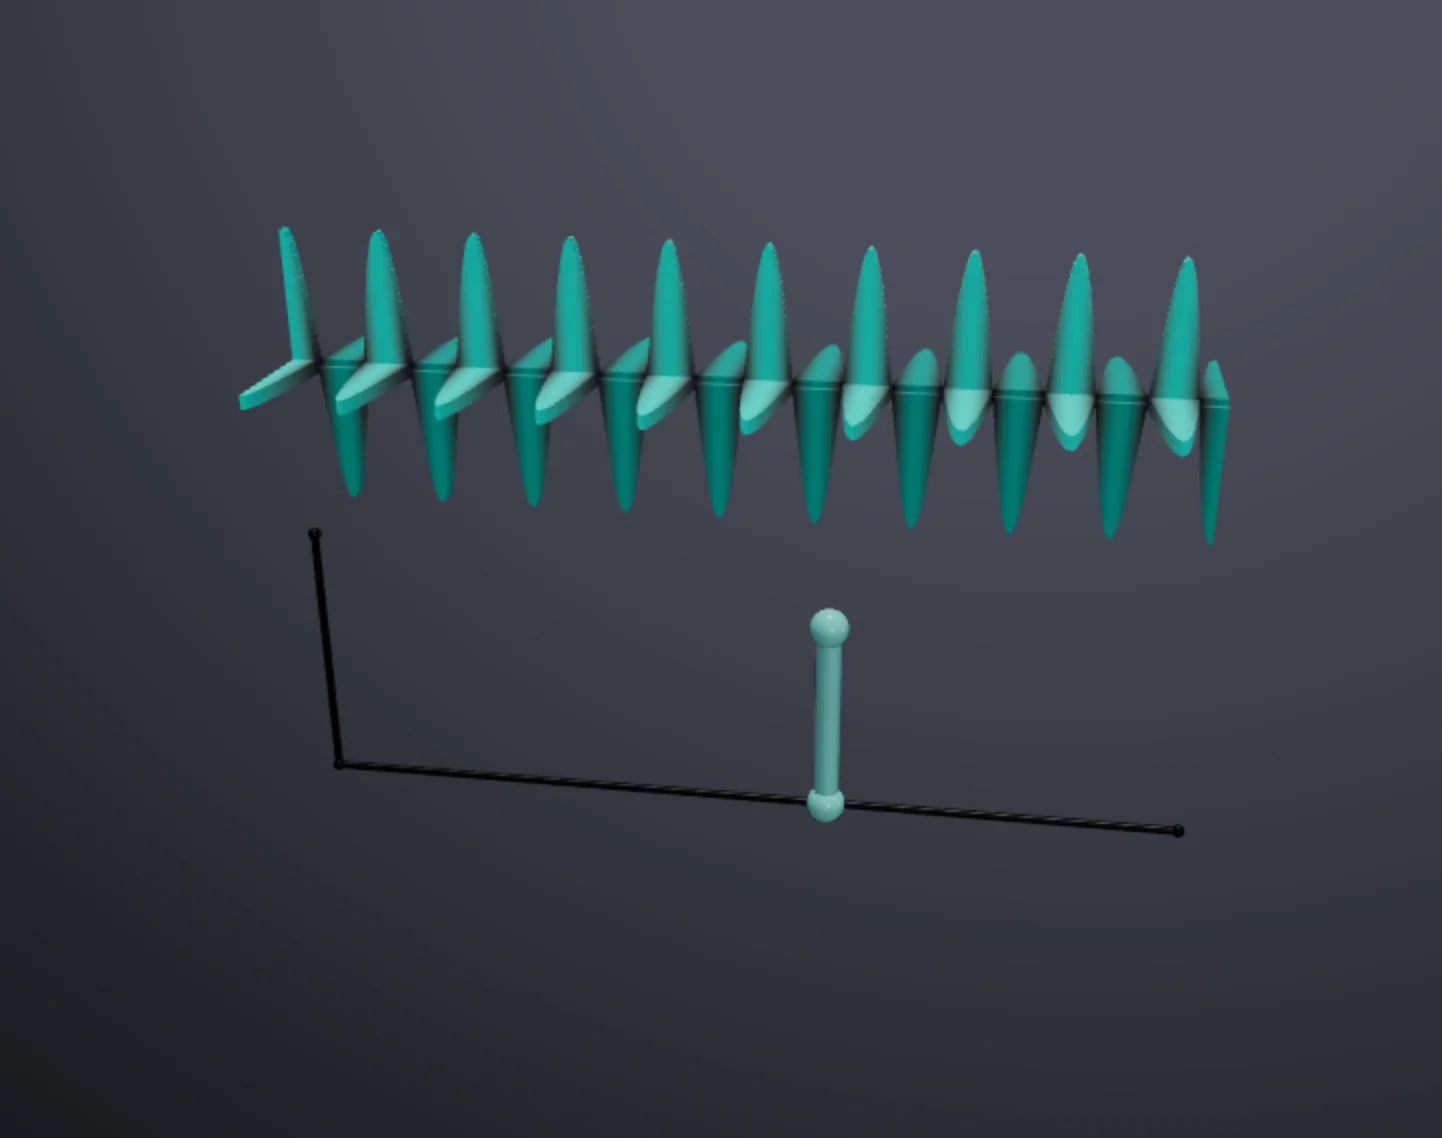
Spectral power distribution scanned by a monochromatic wave, decomposing light into wavelength components
Displays a spectral curve alongside a scanning monochromatic wave that sweeps through the visible wavelengths. As the wave traverses the spectrum, a bar chart shows the current intensity at each wavelength, decomposing the spectrum into its monochromatic components and illustrating the basis of spectral analysis.
Controls: Click and drag to orbit, scroll to zoom.